MAG-UX monitors the performance and
security of IoT Devices and IT
service infrastructure in a highly
visible and intuitive manner,
enabling a service failure across
end-to-end sections.
WHY
MAG-UX
MAG-UX analyzes “wire data” to diagnose
IT service failures in performance and
security, and thus can identify both
intentional and unintentional
failures.
In the case of IoT services, MAG-UX
Micro Engine(MUME) is installed on IoT
devices to understand security and
performance(device health check, network
access detection, etc.).
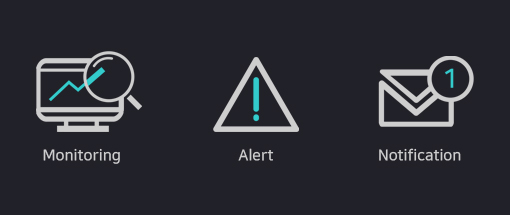
Advantage
Real-time
Processing
MAG-UX
provides
alerts and
notifications
of status
reaching
beyond
certain
thresholds
by real-time
monitoring
at
one-second
interval.
And it is
easy, fast
and
intuitive to
use.
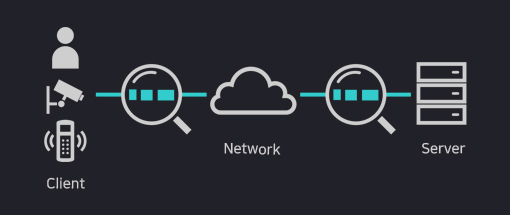
Sectional
Analysis
MAG-UX
analyzes
status of IT
infra by
section
level as
well as
component
level, and
signals any
anomalous
status. This
enables you
to find a
failed
section
(element)
promptly.
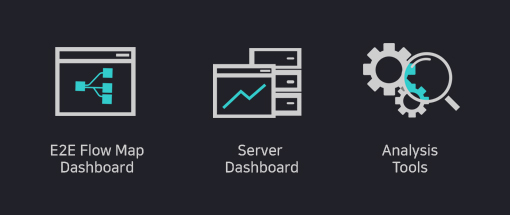
Diagnosis
&
Analysis
MAG-UX
provides
various
dashboards
and
real-time
analysis
tools to
find the
elements and
causes of
failures
preemptively.
This powers
an “IT
control
tower” for
performance
and security
monitoring.
Features
IT Control Tower
Performance analysis and
evaluation of IoT devices and IT
service infrastructure
Monitor security and performance
by installing an on-device
modules MAG-UX Micro
Engine(MUME) on IoT devices.
Real-time monitoring
Analysis of all elements
End-to-end analysis
Tools for easy and fast
decision-making
Deployment without adding a
failure element
Anomaly detection
Features
Sectional Switch Mirroring(Port
Mirroring for Each Section)
Agentless architecture not
giving overloads to a server
Not
Generating additional
packets for
monitoring
Not
using SNMP or flow data
methods that have
difficulties in real-time
processing
Not
using a script injection
method causing a potential
security issue
Features
Real-time transaction analysis
between client and server
Network Round Trip Time (RTT),
usage measurement (BPS/TPS/etc.)
Monitoring client applications
(5Tuple/URL)
Analysis and tracking of
anomalous activities (Anomaly
TR/CPS/PPS/etc.)
Connection performance
measurement by client
environments (by region)
Measuring server response
time(Latency) and waiting
session (Wait)
Metrics assessment by
application URI/DB query
Transaction analysis and anomaly
detection by mirrored packet
analysis